- Home
-
Products and Solutions
-
-
Industy Leaders
-
 EPG has been pioneering the development and deployment of synchrophasor technologies since 2000 and helping reliability operations across all three interconnections (WECC, EI and ERCOT)
-
EPG Products
- intelligent Transmission Asset Monitor (iTAM)
- enhanced Grid Event Notifications System (eGENS)
- Real-Time Dynamics Monitoring System (RTDMS)
- Phasor Grid Dynamics Analyzer (PGDA)
- enhanced Phasor Data Concentrator (ePDC)
- Phasor Simulator for Operator Training (PSOT)
- enhanced Linear State Estimator (eLSE)
- PhasorSmart
- Automated Event Miner (AEM)
- Generator Model Validation (GMV)
- DataNXT
- PhasorNXT
- enhanced Phasor Data Extractor (ePDE)
- All Products
-
EPG Solutions
- Real Time Systems
- Analytics
- Data Management and Archiving
- Data Quality
-
-
- Projects and Services
- TRAINING
- SUCCESS STORIES
- About EPG
RTDMS
Real Time Dynamics Monitoring System
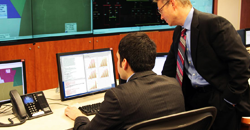
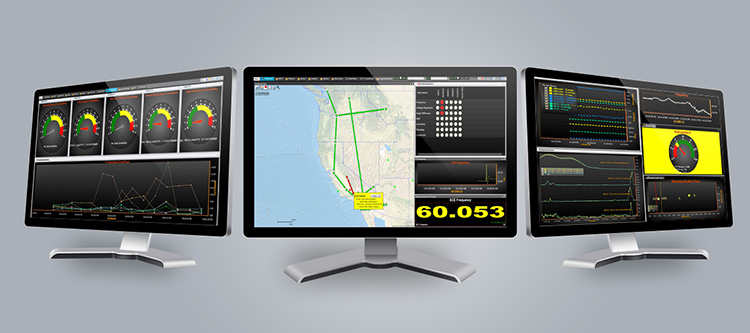
RTDMS is a comprehensive platform for real-time wide-area analysis and monitoring using Synchrophasor data for use in control centers. RTDMS functions include data management, analysis and archiving; real-time visualization; and remote client access via the Intelligent Synchrophasor Gateway (ISG). The data functions include data parsing, bad data detection and handling, calculations, and advanced algorithms including event detection, mode meter, sensitivity, oscillation, islanding detection, etc. The visualization provides a dashboard with all key metrics including frequency, phase angles, power flows, voltages, damping and other key metrics available to operators at a glance for comprehensive wide-area real-time visualization and situational awareness.
The use of RTDMS enables users to:
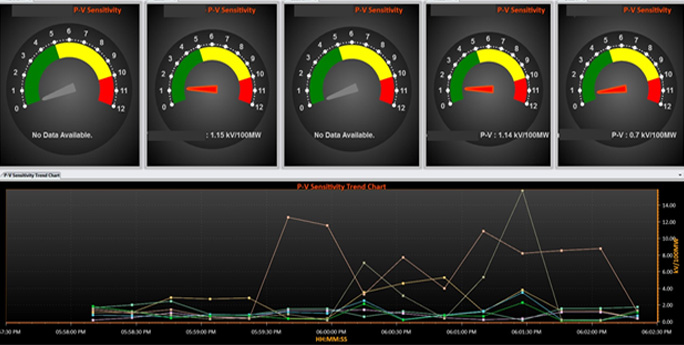
- • Take timely corrective actions to address vulnerabilities like oscillations, low damping, large phase angle, diverging phase angle trend, high voltage sensitivity etc.
- • Make better use of the transmission system by knowing how far we are from the edge
- • Improve models by comparing actual system behavior with model results
Use Cases of RTDMS
- Wide Area Visualization
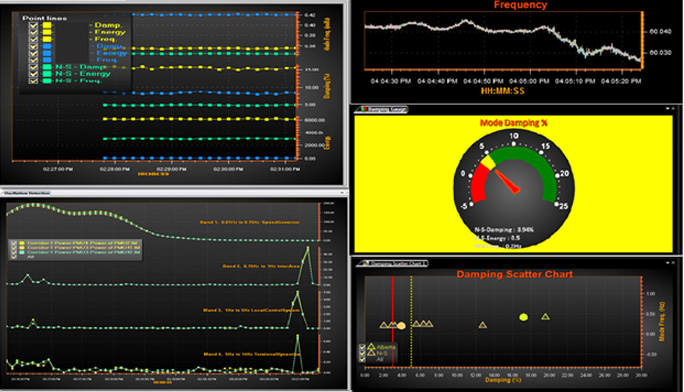
- Oscillation Detection and Monitoring
- Voltage Stability Monitoring
- Event Detection and Alarms
- Other Applications
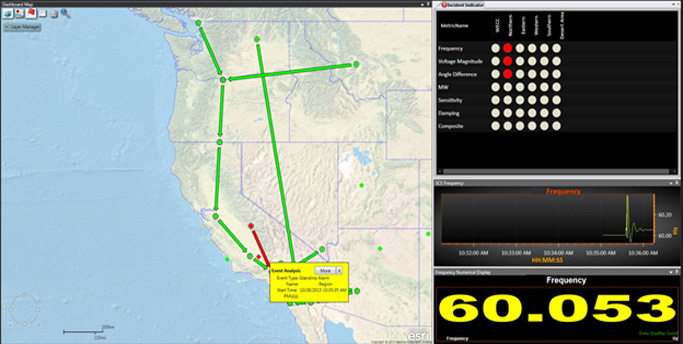
Wide Area Visualization
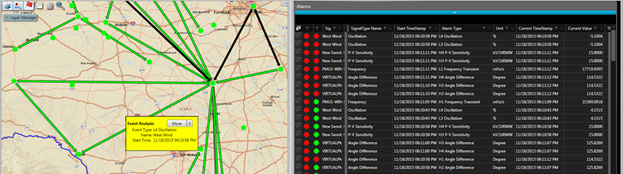
RTDMS provides displays that enable the user to monitor the entire power grid, diagnose events occurring in the system and take required actions. The situational awareness dashboard provides geospatial displays and views for metrics such as phase angle differences, voltages, frequencies and power flows. Alarms and event analyzer popups in RTDMS enable quick and easy detection and diagnosis of the events as to identifying the time, location and the severity of the event.
Key Features
-
Automated Event Analyzer
- Automatic Event notifications and analysis when there is an event.
-
Monitoring Grid Stress
- Real-time tracking and assessment of angular separation across the grid to prevent conditions leading to blackouts.
-
Visualization
- Dashboard Displays, Local Displays, Geospatial views, Bar Charts, Polar Charts, Dial Chart, Pie Charts, Numeric Charts.
-
Reclosing Lines after Events
- Use real-time phase angle information to reclose lines after events.
-
Reporting
- PMU Performance, Baseline Trends, Alarm Logs, Daily Report
-
Event Replay
- Event Replay, Archival and Access of event data for post disturbance event analysis and performance analysis
-
Open Extensible Platform
- Data Input - Standard C37.118 Format
- Open Architecture
- Integrate various data sources
- Modular Build - Ability to plug in new functionality, algorithms, monitoring tools/techniques